Heat Maps
What are Heat Maps?

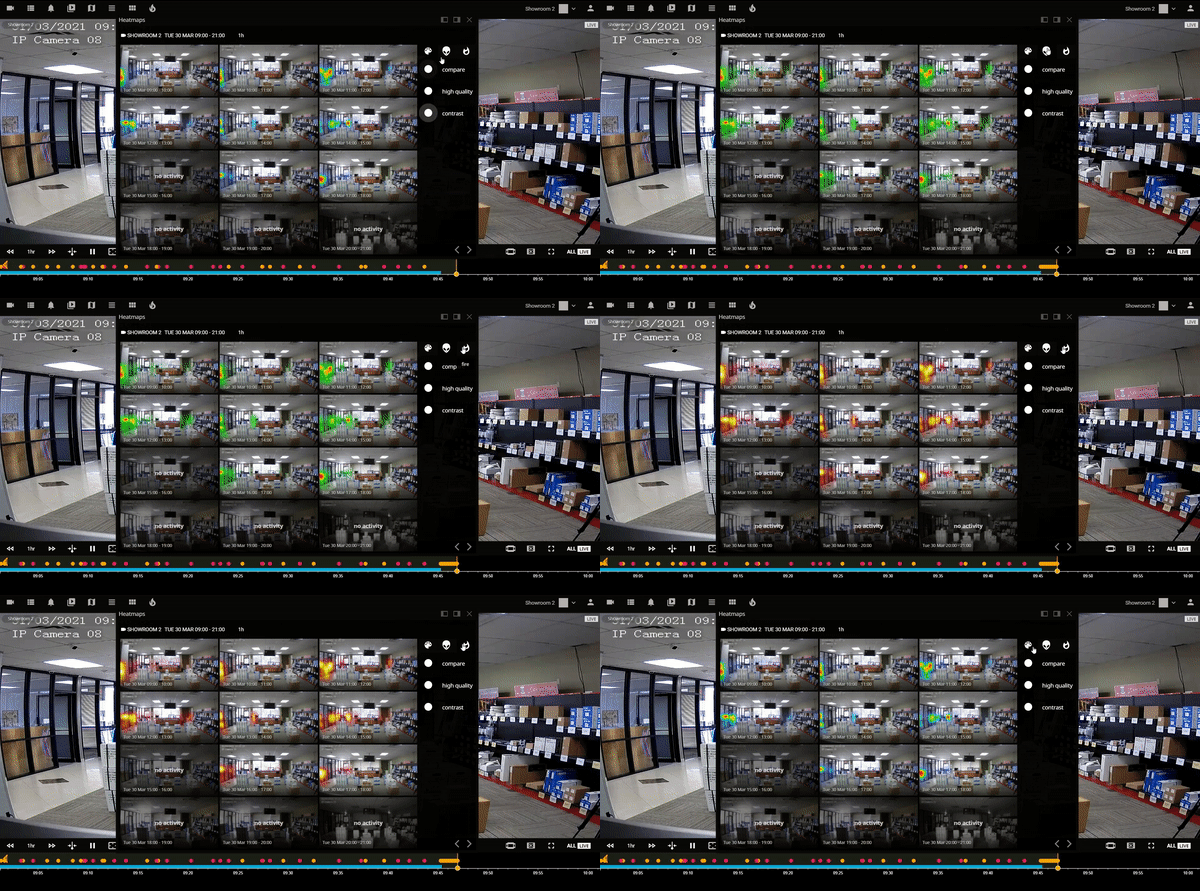
Heat Maps is a visual technique that shows the frequency of motion detected. Most cameras use motion detectors to determine moving objects but iFovea’s Heat Maps are more accurate in determining animate and inanimate clusters using their object classification technology. For example, a regular camera with motion detection will detect anything that moves, like a leaf falling off a tree or a plastic bag blowing in the wind. Heat Maps can pinpoint the presence of high traffic areas and movement.
Business & Traffic Optimization
The main purpose of using Heat Maps is to show where the most activity has taken place. Using Heat Maps enables people to analyze and understand consumer behavior better. In retail, it can be used to track where most people have been and can also track idle time and determine when and where people have stopped to look at something and when people have just moved through. Like the object tracking feature, heatmaps can be used to help businesses revise the store layouts. The service also detects vehicles to see where people are driving and stopping. This can be used as a tool to help identify traffic issues. On the Heat Maps, the red splotches indicate that more people have moved through that area. City planners can use this information to determine areas where more cars tend to cluster or where bottlenecks start to occur.

Crowd Management
Identifies busy areas so that additional staff members can be stationed to assist customers.

Crowd Path
Monitors how customers are moving within the store for optimal product placement.

Product Conversion Tracking
Tracks which products are being looked at the most and what percentage is being converted to purchases.

Customer Attention
Determines which areas customers are more likely to browse to provide a deeper understanding of what attracts them.